Written June 28th 2024
The beginning of Summer 2024 is seeing gold prices ascend to near-historic levels, reaching over $2,300 per ounce, and creeping up to $2,400. With economic uncertainty looming, geopolitical tensions intensifying, and global markets feeling the weight of inflation, gold has once again proven itself as a refuge for investors. But what drove this surge, and how can you, as an investor, take advantage of it?
A Hedge Against Economic Turmoil
The key to understanding gold’s meteoric rise lies in its role as a hedge against financial instability. The Federal Reserve's move from raising interest rates to cutting them throughout 2024 has played a major role. With the Fed funds around 5.33% currently, with cuts expected later this year and more in 2025, many investors flocked to gold as lower rates make non-interest-bearing assets like gold more attractive. Additionally, looming fears of a recession and inflation have pushed gold to the forefront as a safe-haven investment.
Geopolitical Pressures Pushing Prices Higher
Gold prices also benefited from increased geopolitical tensions, particularly the ongoing Russia-Ukraine conflict, which has continued into its second year, as well as unrest in the Middle East. Wars tend to drive up the value of hard assets like gold as they introduce uncertainty and volatility into the markets. The recent attacks on U.S. naval vessels by Iranian forces have only compounded these uncertainties
U.S. Debt and Credit Concerns
The surging U.S. national debt, which now exceeds $33 trillion, has stoked fears about the long-term stability of the U.S. dollar. Additionally, in 2024, the U.S. government faced another credit rating downgrade, further weakening the dollar and boosting gold prices. As faith in fiat currency declines, investors increasingly look to gold as a store of value, especially given its historical reliability.
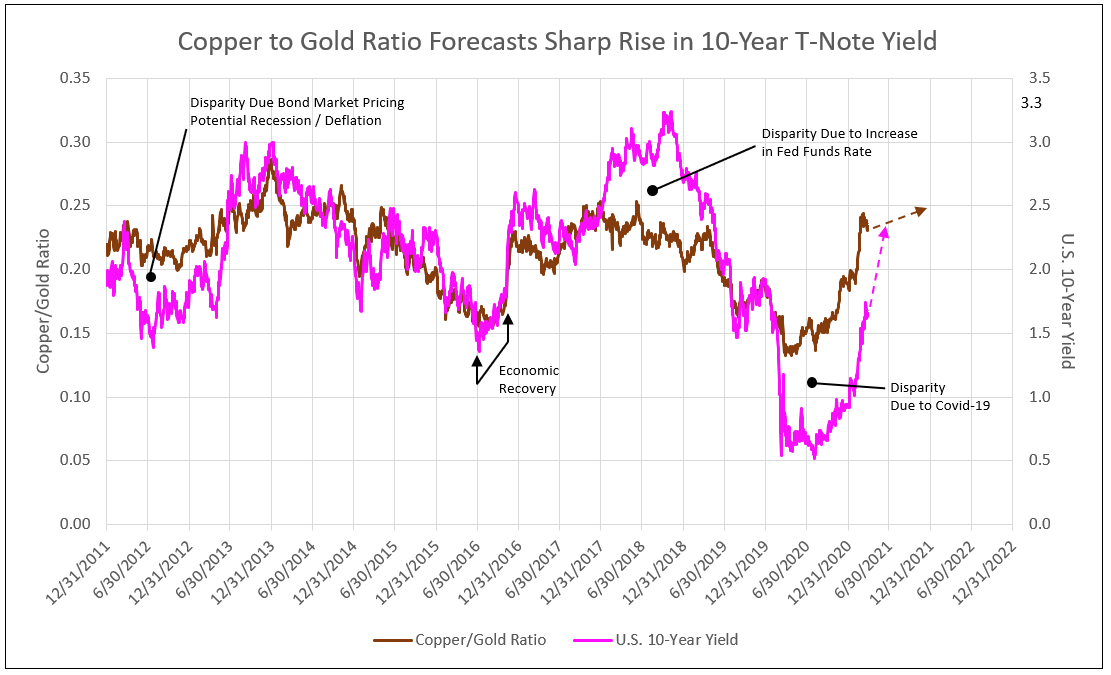
Copper-to-Gold Ratio: What It Tells Us
An often-overlooked indicator of economic health is the copper-to-gold ratio. This ratio compares the price of copper, a key industrial metal, to the price of gold, a traditional store of value. A high copper-to-gold ratio typically signals economic growth and rising inflation expectations, as copper demand is driven by industrial activity. Conversely, a falling copper-to-gold ratio, as seen during 2024, may indicate slowing economic growth or heightened concerns about future recessions.
As of mid-2024, the copper-to-gold ratio dropped significantly, aligning with growing recession fears and reduced industrial activity. Historically, this ratio has been a reliable predictor of long-term bond yields, and its recent decline suggests continued economic stress ahead. Investors often turn to gold in such periods, further supporting its price. You can see the current copper-to-gold ratio in the chart below, sourced from Longtermtrends:
The Numbers Behind the Surge
From May through August 2024, gold prices hovered between $2,400 and $2,500 per ounce—remarkably high by historical standards. Adjusted for inflation, today's gold prices are approaching levels last seen in the 1970s, during the U.S. stagflation crisis. While speculative, some experts believe that with continued rate cuts and escalating geopolitical concerns, gold could climb even higher in 2025 and beyond, possibly reaching $2,600 or even $2,800.
What Should Investors Do Now?
Given the current economic climate, gold ETFs offer a convenient way to gain exposure to precious metals. SPDR Gold Shares (GLD) remains a popular choice for those seeking pure gold exposure. If you're looking for a diversified option that includes both gold and silver, SPDR's Silver Trust (SLV) could also be worth considering, especially as silver often mirrors gold’s movements during times of economic turmoil. For those with a longer investment horizon, physical gold or gold miners (Vaneck Gold Miners ETF: GDX is a good choice) might offer additional upside as prices continue to climb.
In a world of uncertainty, gold stands tall. The summer of 2024 was a testament to that.
https://elements.visualcapitalist.com/visualizing-gold-price-and-u-s-debt-1970-2023/